“Listen to the sound of the river and you will get a trout.”
~Irish proverb.
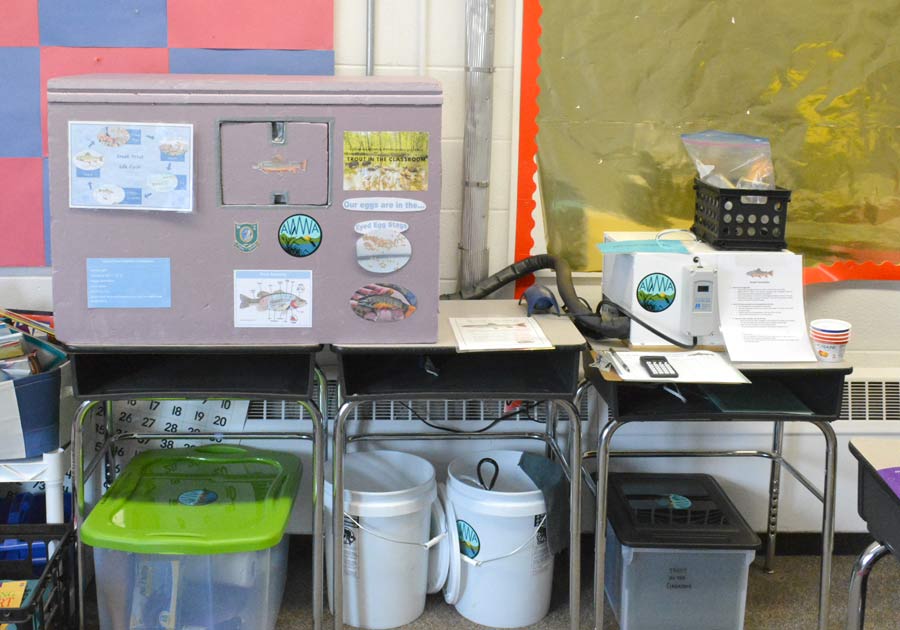
After last year’s success with the Trout in the Classroom Program, we decided to bring brook trout back into the 4th grade classrooms of Wakefield. Schools all across New Hampshire participate in this program, which is facilitated by the New Hampshire Fish and Game Department and in partnership with Trout Unlimited. AWWA works with the Paul School to help provide the equipment, coordinate the program, and deliver educational lessons. Our eggs are provided by the Powder Mill Fish Hatchery in New Durham.

Last year we learned SO much about New Hampshire’s program, and decided to find out if Maine offered anything similar so that Acton Elementary could participate. It turns out that Maine does not have a statewide run Trout in the Classroom program, but schools can still raise trout with a little guidance from Maine Department of Inland Fisheries & Wildlife (IF&W). There are several organizations in Maine that facilitate schools raising brook trout. Thanks to their guidance we began working with a hatchery, and with IF & W to obtain trout release permits to raise trout with Acton’s 7th grade!
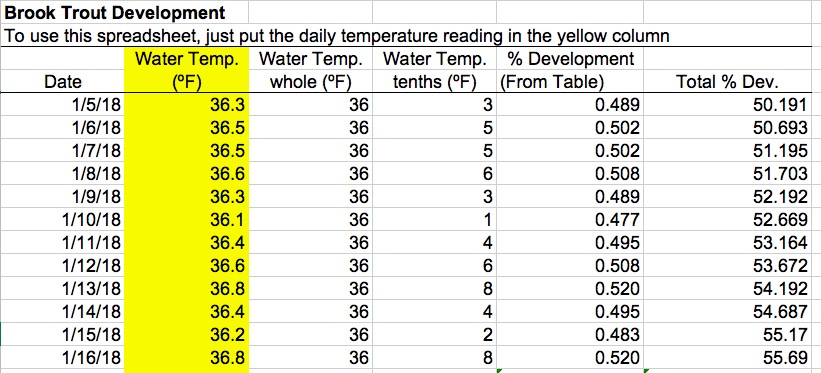
Students will track daily development as they experience brook trout evolving from egg to fry in their classrooms. Over the coming months they will learn about anatomy, water quality, habitat, food webs and much more. Because trout development is temperature dependent, daily tracking is necessary to determine life cycle stages. The warmer the water, the quicker they develop, and our goal is to keep the tank at a range of 35° – 38°F. Development is measured using the Brook Trout Developmental Index Chart.
| Brook Trout Developmental Index | ||||||||||
| Temp F | 0 | 0.1 | 0.2 | 0.3 | 0.4 | 0.5 | 0.6 | 0.7 | 0.8 | 0.9 |
| 35 | 0.41 | 0.416 | 0.422 | 0.428 | 0.434 | 0.441 | 0.447 | 0.453 | 0.459 | 0.465 |
| 36 | 0.471 | 0.477 | 0.483 | 0.489 | 0.495 | 0.502 | 0.508 | 0.514 | 0.52 | 0.526 |
| 37 | 0.532 | 0.538 | 0.544 | 0.55 | 0.556 | 0.562 | 0.568 | 0.574 | 0.58 | 0.586 |
| 38 | 0.592 | 0.598 | 0.604 | 0.61 | 0.616 | 0.623 | 0.629 | 0.635 | 0.641 | 0.647 |
| 39 | 0.653 | 0.659 | 0.665 | 0.671 | 0.677 | 0.684 | 0.69 | 0.696 | 0.702 | 0.708 |
| 40 | 0.714 | 0.722 | 0.729 | 0.737 | 0.745 | 0.753 | 0.76 | 0.768 | 0.776 | 0.783 |
How to use the chart:
- The left hand column is temperature in Fahrenheit; 35, 36, 37, etc.
- The row across the top is tenths of degrees (the decimal); 35.3, 36.4, 37.5, etc.
- The decimal figures found at the intersection of the left hand column and the row across the top represent how much the eggs developed at a certain temperature.
- The goal is to have a cumulative total of all the daily development percentages.
Example:
- At 35.1°F, the eggs have developed 0.416% for that day at that temperature.
- At 35.2°F, the eggs have developed 0.422% for that day at that temperature.
Total development = 0.838%
Development Stages:
- Weakly eyed 29%
- Shocking 38-42%
- Strongly eyed 47% (When we pickup the eggs from the hatchery they will be strongly eyed)
- Hatched 73%
- Swim up 100%
Students will be keeping a daily development log similar to the one below.
Keep checking back in for more updates!