
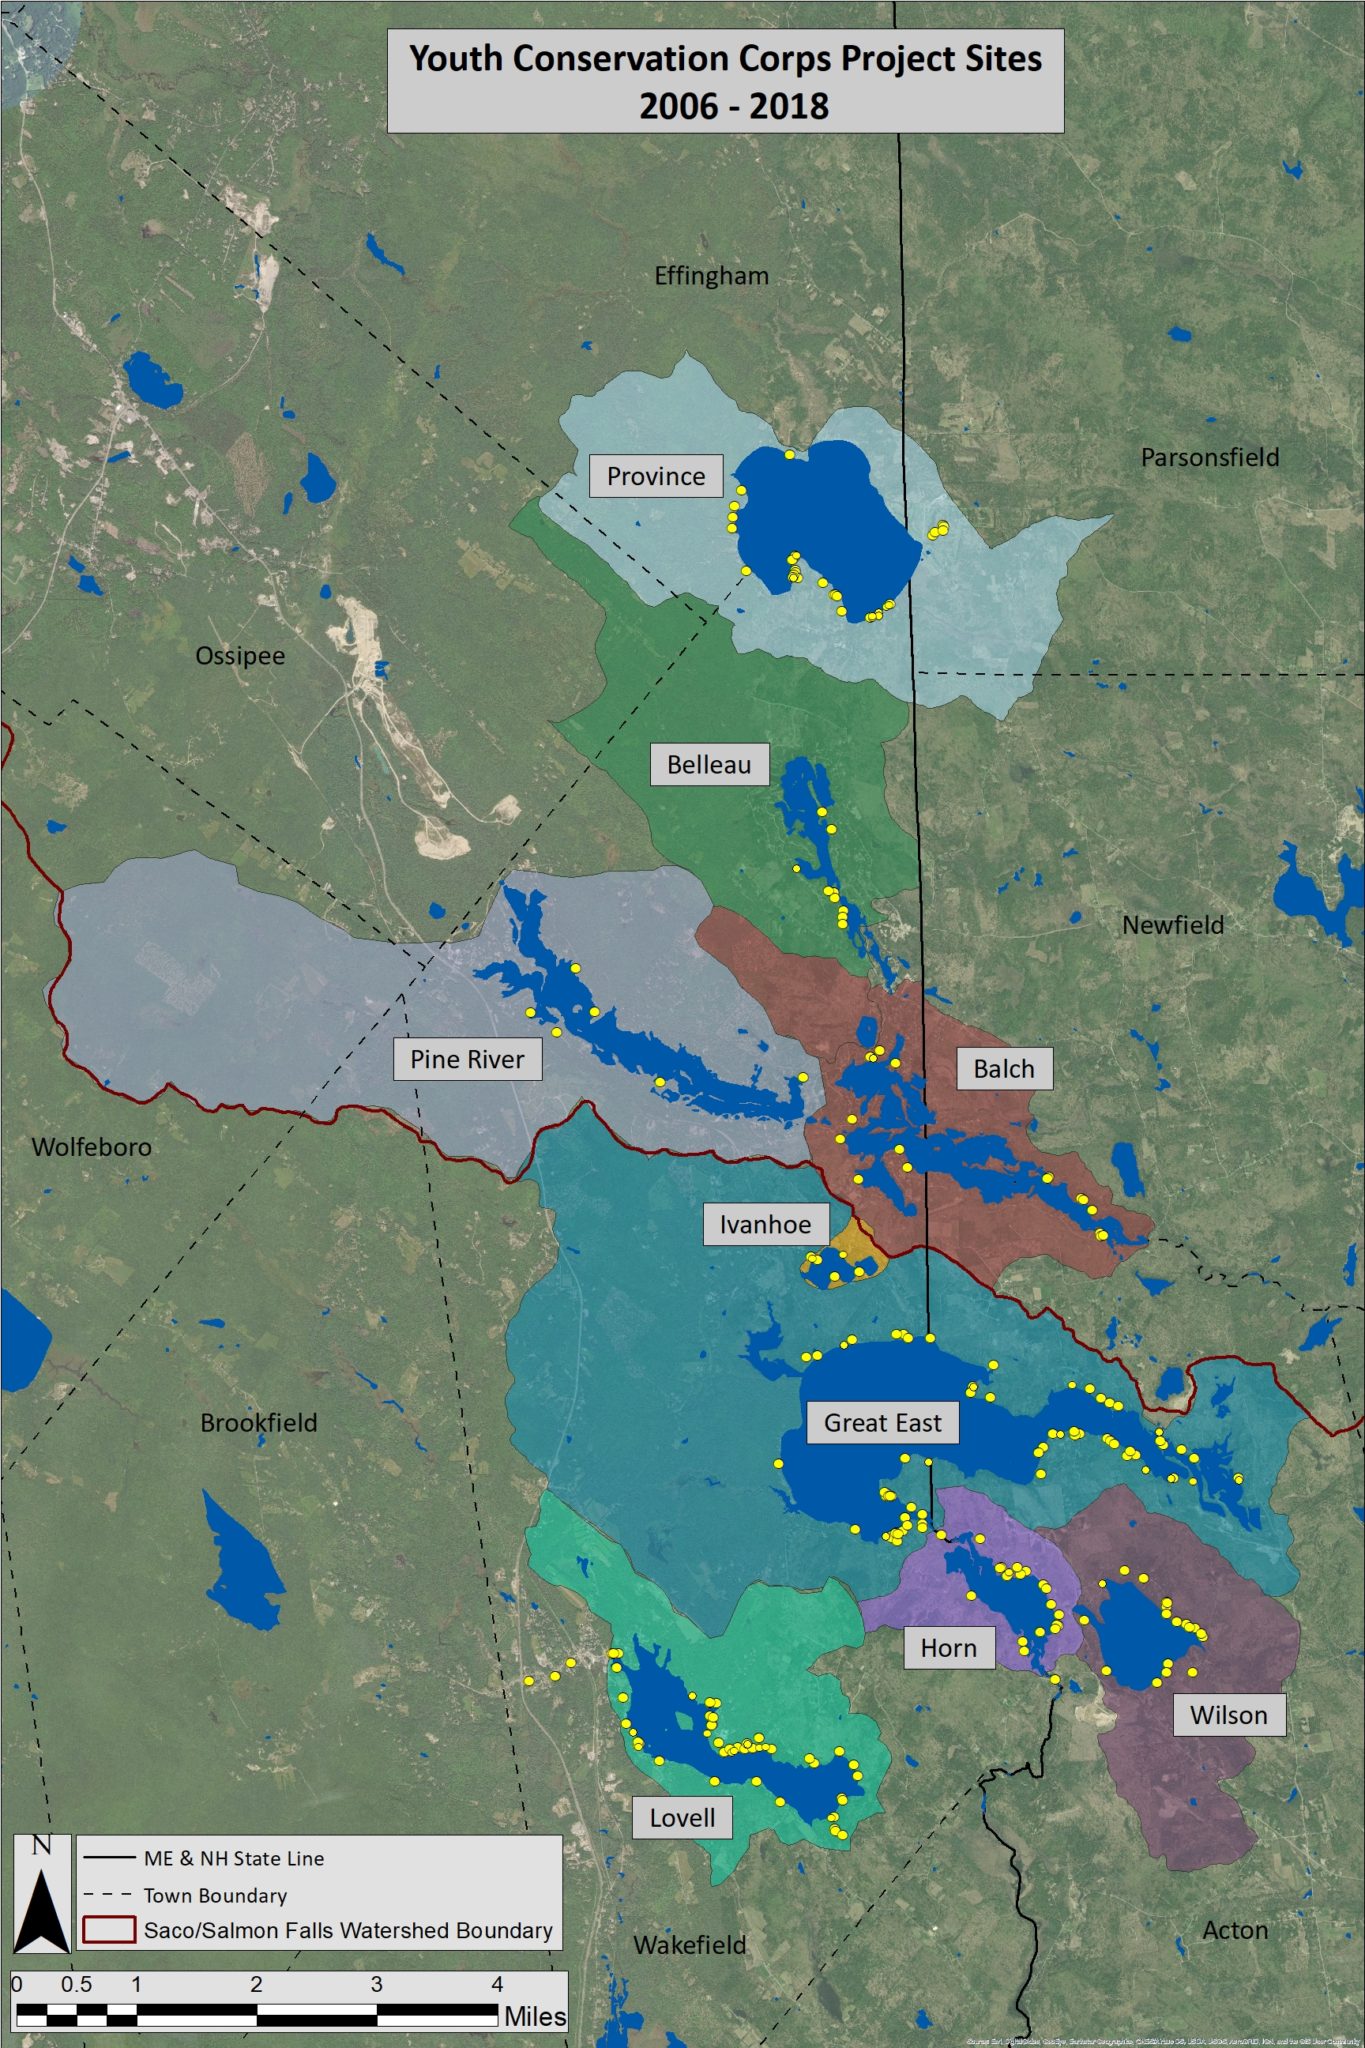
If you are all about the numbers, this post is for you! In looking at all of our statistics, we are proud of all the work that has been done in our region to protect water quality. However, there is still so much work can be done! For example, AWWA’s Youth Conservation Corps (YCC) has installed over 240 projects, but between Acton and Wakefield, there are easily over 2,000 properties in AWWA’s service area. Granted, many property owners do take the initiative and make their properties more lake friendly on their own (you rock!).
For the most part, something can be done on every property to have a positive impact on water quality. Simple Best Management Practices (BMPs), such as adding plants and groundcover not only makes soils more stable, but vegetation helps filter out pollutants before they can reach the lake.
For all of AWWA’s most recent YCC stats, check out the info below!
YCC Projects by Lake
| Total | 2006 | 2007 | 2008 | 2009 | 2010 | 2011 | 2012 | 2013 | 2014 | 2015 | 2016 | 2017 | 2018 | |
| Balch | 18 | 3 | 1 | 0 | 1 | 2 | 2 | 0 | 3 | 2 | 2 | 1 | 1 | 0 |
| Belleau | 8 | 1 | 1 | 3 | 0 | 0 | 0 | 1 | 0 | 0 | 0 | 1 | 1 | 0 |
| Great East | 70 | 3 | 6 | 6 | 3 | 2 | 4 | 5 | 11 | 6 | 9 | 4 | 9 | 2 |
| Horn | 21 | 0 | 1 | 1 | 1 | 5 | 2 | 1 | 2 | 4 | 1 | 2 | 0 | 1 |
| Ivanhoe | 6 | 0 | 0 | 0 | 0 | 1 | 0 | 0 | 0 | 0 | 2 | 1 | 0 | 2 |
| Lovell | 56 | 3 | 6 | 2 | 8 | 6 | 4 | 6 | 4 | 3 | 1 | 3 | 3 | 7 |
| Pine River | 6 | 0 | 0 | 0 | 0 | 0 | 1 | 2 | 1 | 0 | 2 | 0 | 0 | 0 |
| Province | 34 | 0 | 1 | 1 | 2 | 1 | 3 | 2 | 1 | 6 | 2 | 7 | 3 | 5 |
| Wilson | 19 | 0 | 2 | 1 | 3 | 0 | 5 | 1 | 3 | 0 | 1 | 2 | 1 | 0 |
| Other | 9 | 0 | 2 | 1 | 0 | 1 | 0 | 2 | 0 | 1 | 2 | 0 | 0 | 0 |
| Total | 247 | 10 | 20 | 15 | 18 | 18 | 21 | 20 | 25 | 22 | 22 | 21 | 18 | 17 |
YCC Projects by Watershed
| Total | 2006 | 2007 | 2008 | 2009 | 2010 | 2011 | 2012 | 2013 | 2014 | 2015 | 2016 | 2017 | 2018 | |
| Saco | 66 | 4 | 3 | 4 | 3 | 3 | 6 | 5 | 5 | 8 | 6 | 9 | 5 | 5 |
| Salmon Falls | 181 | 6 | 17 | 11 | 15 | 15 | 15 | 15 | 20 | 14 | 16 | 12 | 13 | 12 |
| Total | 247 | 10 | 20 | 15 | 18 | 18 | 21 | 20 | 25 | 22 | 22 | 21 | 18 | 17 |
YCC Projects by Town
| Total | 2006 | 2007 | 2008 | 2009 | 2010 | 2011 | 2012 | 2013 | 2014 | 2015 | 2016 | 2017 | 2018 | |
| Acton | 78 | 2 | 5 | 4 | 3 | 6 | 7 | 5 | 15 | 7 | 6 | 8 | 7 | 3 |
| Effingham | 5 | 0 | 0 | 0 | 0 | 1 | 0 | 0 | 1 | 2 | 0 | 1 | 0 | 0 |
| Newfield | 6 | 0 | 0 | 0 | 0 | 1 | 1 | 0 | 1 | 2 | 1 | 0 | 0 | 0 |
| Parsonsfield | 5 | 0 | 0 | 0 | 0 | 0 | 0 | 0 | 0 | 0 | 0 | 5 | 0 | 0 |
| Wakefield | 153 | 8 | 15 | 11 | 15 | 10 | 13 | 15 | 8 | 11 | 15 | 7 | 11 | 14 |
| Total | 247 | 10 | 20 | 15 | 18 | 18 | 21 | 20 | 25 | 22 | 22 | 21 | 18 | 17 |
BMPs Installed by Lake
| Total | 2006 | 2007 | 2008 | 2009 | 2010 | 2011 | 2012 | 2013 | 2014 | 2015 | 2016 | 2017 | 2018 | Total | |
| Balch | 61 | 15 | 2 | 0 | 5 | 11 | 3 | 0 | 10 | 6 | 3 | 1 | 5 | 0 | 61 |
| Belleau | 31 | 5 | 4 | 8 | 0 | 0 | 0 | 4 | 0 | 0 | 0 | 3 | 7 | 0 | 31 |
| Great East | 304 | 14 | 15 | 15 | 14 | 9 | 14 | 21 | 53 | 22 | 20 | 20 | 66 | 21 | 304 |
| Horn | 102 | 0 | 1 | 6 | 3 | 17 | 13 | 13 | 7 | 23 | 7 | 2 | 0 | 10 | 102 |
| Ivanhoe | 26 | 0 | 0 | 0 | 0 | 3 | 0 | 0 | 0 | 0 | 13 | 4 | 0 | 6 | 26 |
| Lovell | 270 | 11 | 19 | 3 | 30 | 21 | 12 | 52 | 13 | 15 | 3 | 16 | 12 | 63 | 270 |
| Pine River | 47 | 0 | 0 | 0 | 0 | 0 | 8 | 10 | 6 | 0 | 23 | 0 | 0 | 0 | 47 |
| Province | 137 | 0 | 8 | 4 | 6 | 4 | 20 | 8 | 2 | 24 | 6 | 15 | 9 | 31 | 137 |
| Wilson | 68 | 0 | 7 | 2 | 4 | 0 | 21 | 10 | 10 | 0 | 3 | 8 | 3 | 0 | 68 |
| Other | 21 | 0 | 3 | 2 | 0 | 1 | 0 | 7 | 0 | 3 | 5 | 0 | 0 | 0 | 21 |
| Total | 1,067 | 45 | 59 | 40 | 62 | 66 | 91 | 125 | 101 | 93 | 83 | 69 | 102 | 131 | 1,067 |
Technical Assistance Visits by Lake
| Total | 2006 | 2007 | 2008 | 2009 | 2010 | 2011 | 2012 | 2013 | 2014 | 2015 | 2016 | 2017 | 2018 | Total | |
| Balch | 42 | 6 | 3 | 3 | 3 | 4 | 3 | 2 | 5 | 4 | 4 | 3 | 1 | 1 | 42 |
| Belleau | 28 | 6 | 6 | 5 | 2 | 0 | 1 | 3 | 0 | 0 | 0 | 3 | 0 | 2 | 28 |
| Great East | 162 | 13 | 11 | 11 | 6 | 12 | 11 | 20 | 9 | 14 | 21 | 8 | 22 | 4 | 162 |
| Horn | 42 | 1 | 2 | 3 | 5 | 8 | 2 | 3 | 4 | 3 | 2 | 2 | 5 | 2 | 42 |
| Ivanhoe | 17 | 0 | 0 | 3 | 0 | 1 | 0 | 1 | 0 | 0 | 8 | 0 | 2 | 2 | 17 |
| Lovell | 124 | 10 | 6 | 11 | 17 | 8 | 19 | 11 | 6 | 3 | 7 | 5 | 11 | 10 | 124 |
| Pine River | 37 | 2 | 6 | 9 | 2 | 2 | 3 | 6 | 1 | 0 | 3 | 2 | 1 | 0 | 37 |
| Province | 62 | 1 | 1 | 2 | 6 | 4 | 7 | 1 | 10 | 5 | 5 | 13 | 5 | 2 | 62 |
| Wilson | 44 | 2 | 2 | 3 | 6 | 6 | 7 | 4 | 4 | 0 | 2 | 2 | 5 | 1 | 44 |
| Other | 15 | 0 | 5 | 1 | 0 | 1 | 2 | 1 | 1 | 1 | 3 | 0 | 0 | 0 | 15 |
| Total | 573 | 41 | 42 | 51 | 47 | 46 | 55 | 52 | 40 | 30 | 55 | 38 | 52 | 24 | 573 |